Tables
A table shows rows and columns — for detail views, top-10 lists, or anything a chart would summarize too much.
Build a table
Pick your source, then choose the columns from the same field panel as charts — dimensions, measures, metrics. Number columns can be totaled (sum, average, count…) or shown row by row.
The filter bar works exactly like on charts, relative date filters included, and tables respond to tab filters like every other widget.
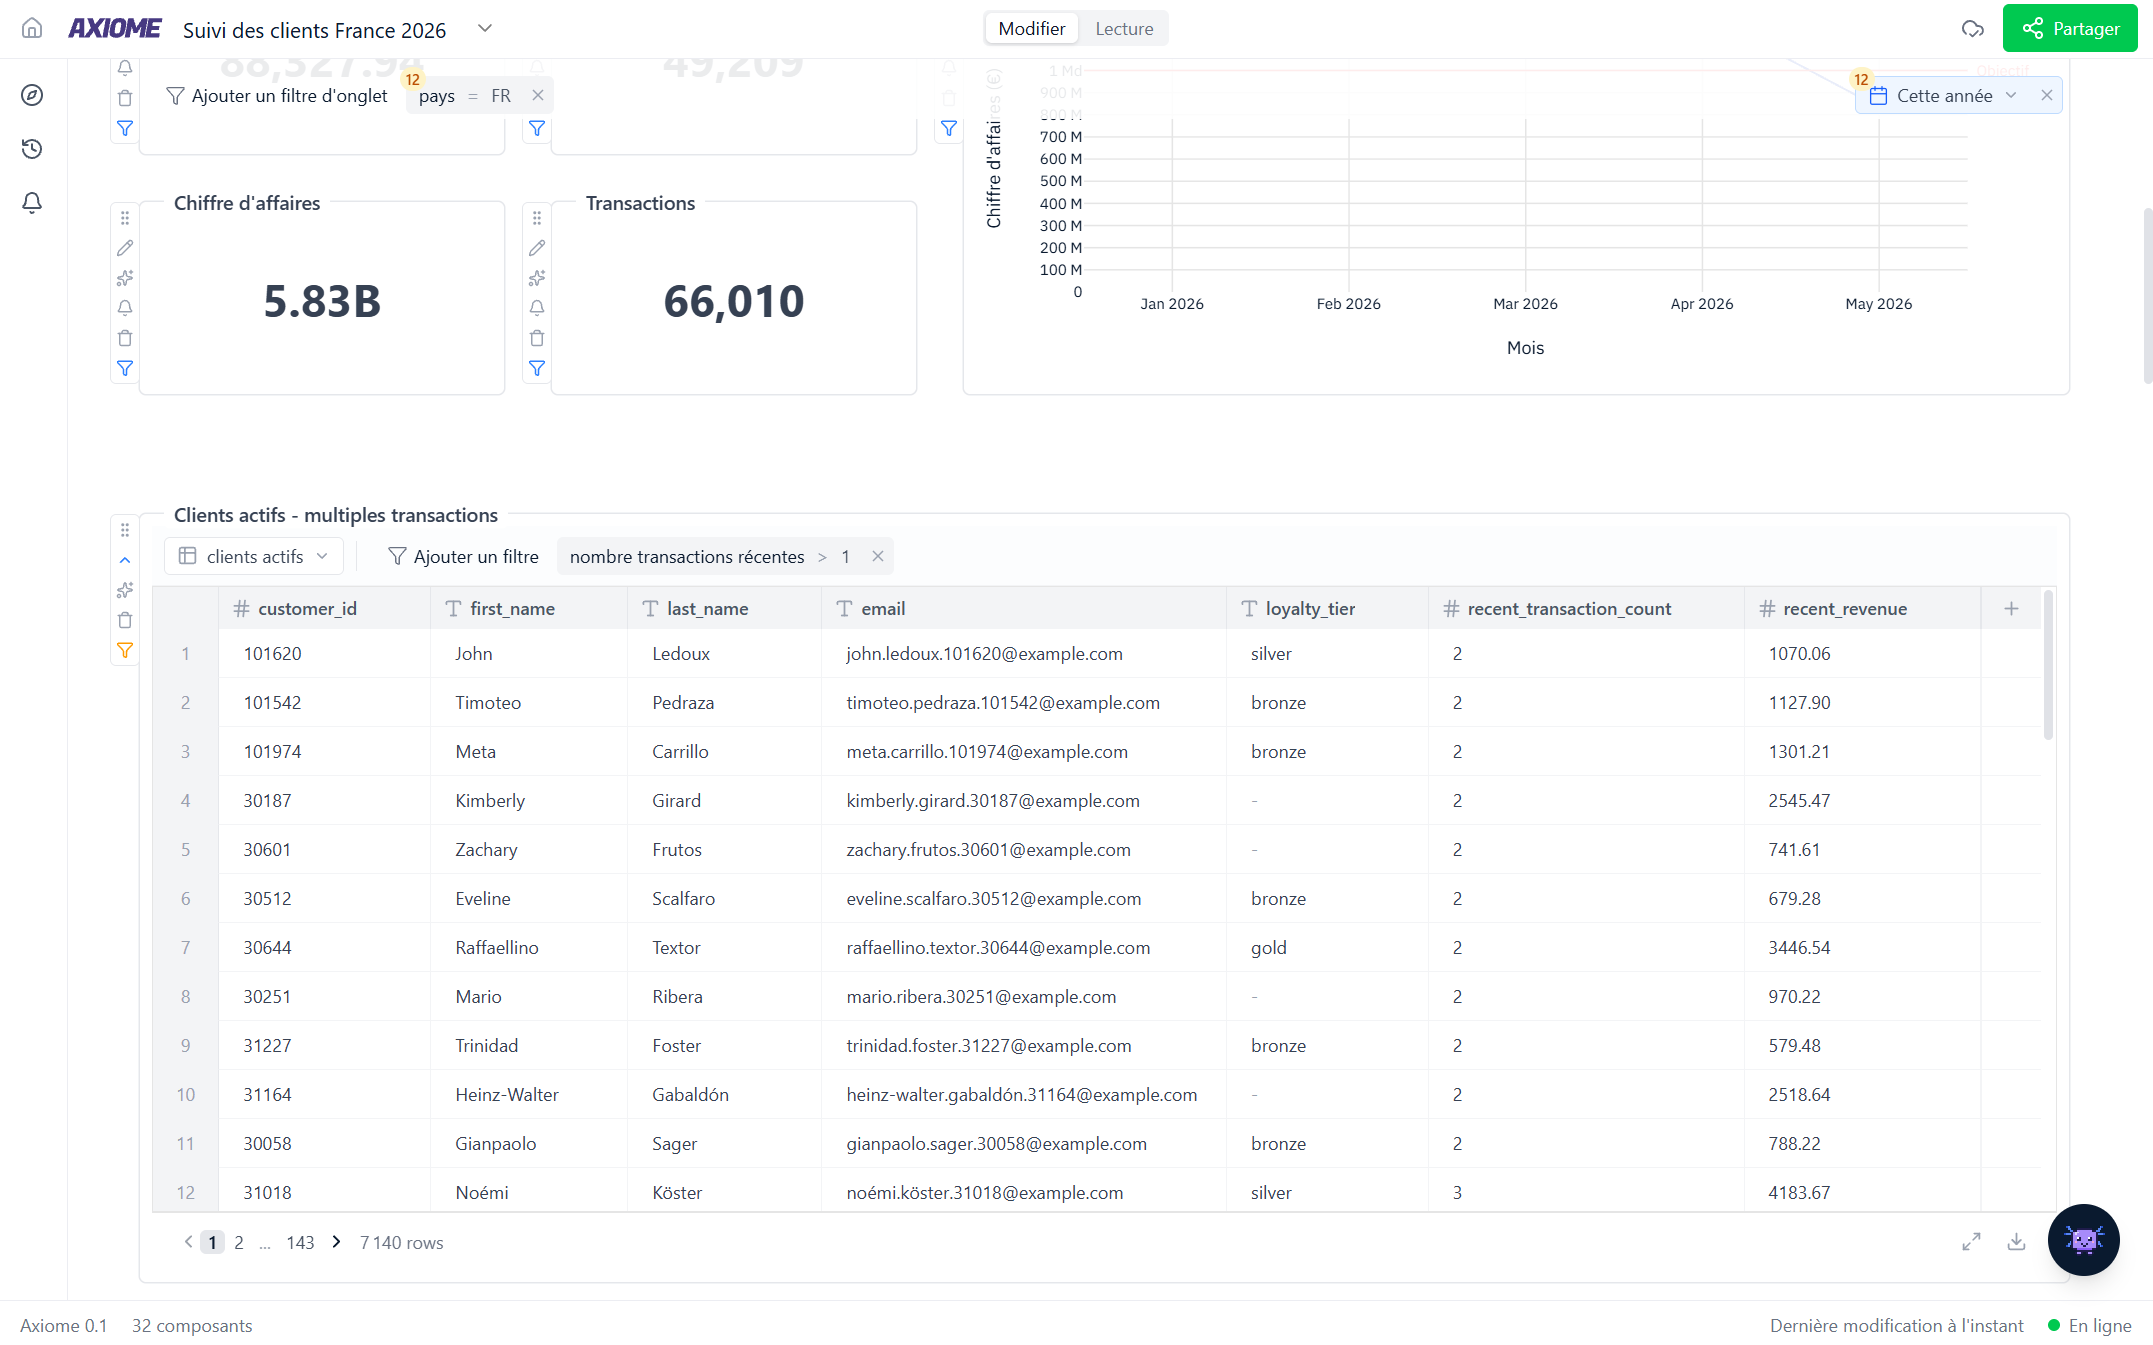
Download the rows
A table can be exported to CSV — handy when someone needs the detail in a spreadsheet, or you're handing data to another tool. The download button offers two options:
- Download current preview — just the rows on screen.
- Download full data — every row the table returns, up to 500 000. Axiome asks you to confirm, since a large table takes a moment to fetch.
Either way the export follows the table as configured: same columns, same filters.
Calculated columns
Need a column that doesn't exist in the data — a margin, a ratio, a label built from other fields? Add a custom function column and write its formula from the other fields. Charts have the same feature. If the calculation is something your whole team should share, ask your administrator to turn it into an official metric instead.