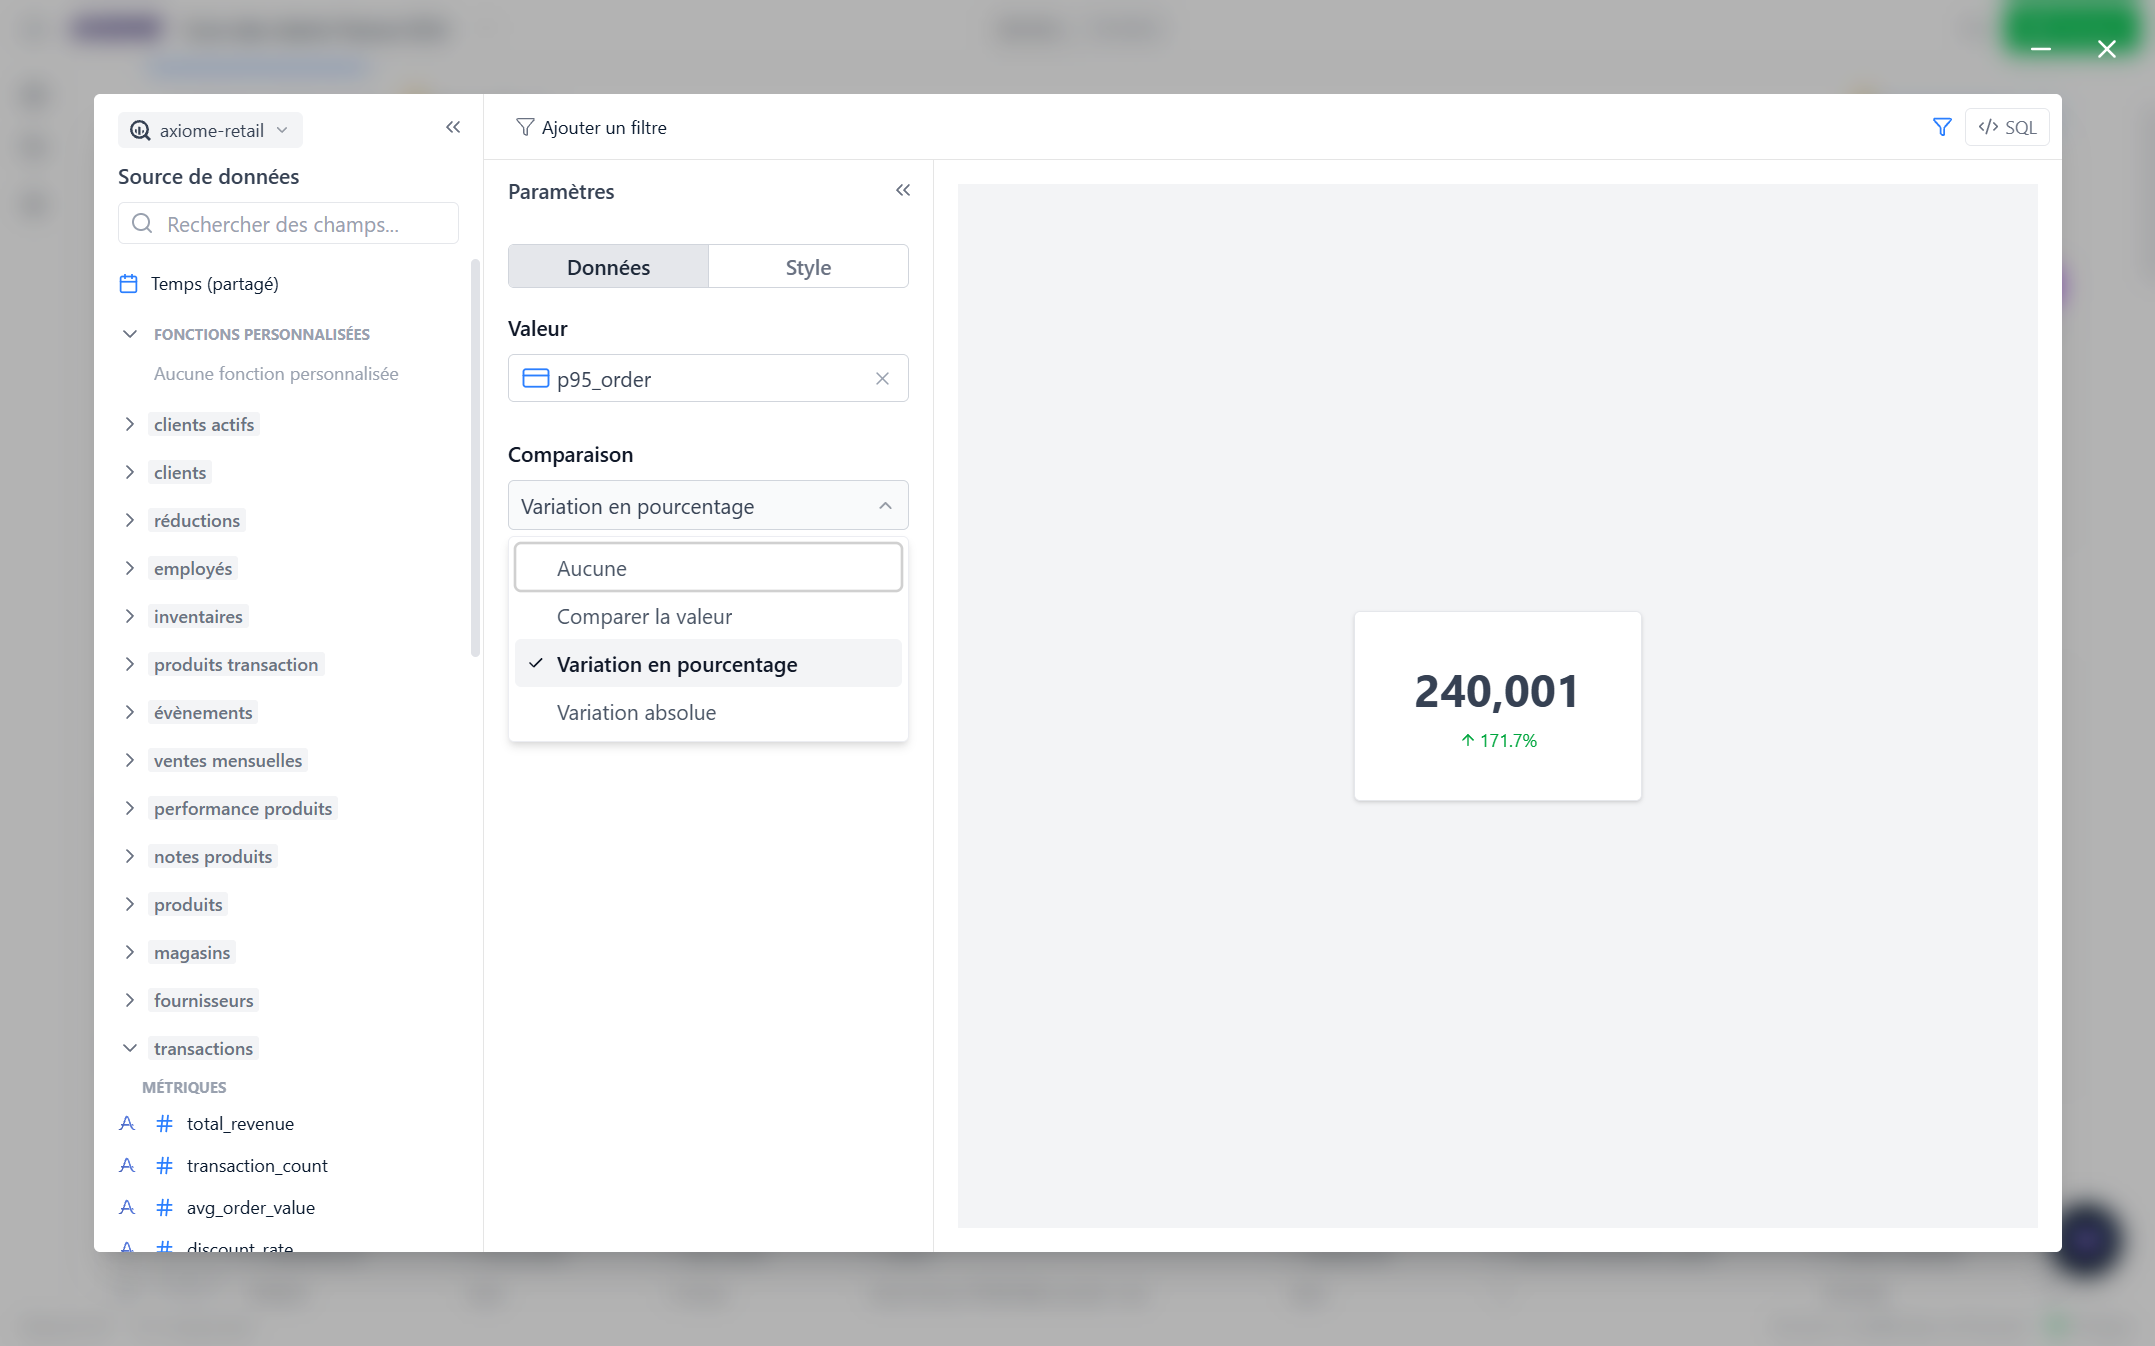
KPI cards
A card shows one number, big: this month's revenue, active users, error rate. Cards are the backbone of executive dashboards.
Set the value
Drop a field on the card's Value slot — typically one of your company's metrics, which brings its official formatting (currency, percent, decimals) with it.
Add a comparison
A card can show how the number moved — usually versus a previous period:
- Percentage change — +12%
- Absolute change — +8 540 €
- Compare value — show the other number alongside
You decide which direction is good news: up for revenue, down for costs or error rates — the card colors the change green or red accordingly.