Building with Axi
Create widgets and dashboards
In a dashboard, tell Axi what you want to see:
- "Show me a chart of monthly revenue"
- "Create a table of recent orders"
- "Build a dashboard with key metrics"
Axi picks the right data, configures the widgets, and places them on the grid. Refine them by hand in the editors, or keep iterating with Axi — both work.
From Home, Axi can also run free-form analyses; keep any widget it produces with Add to dashboard.
Edit an existing widget
The easiest way is the widget's own Ask Axi to edit action — it points the conversation at that exact widget:
- "Switch this to a stacked area chart"
- "Group by country instead of city"
- "Only completed orders"
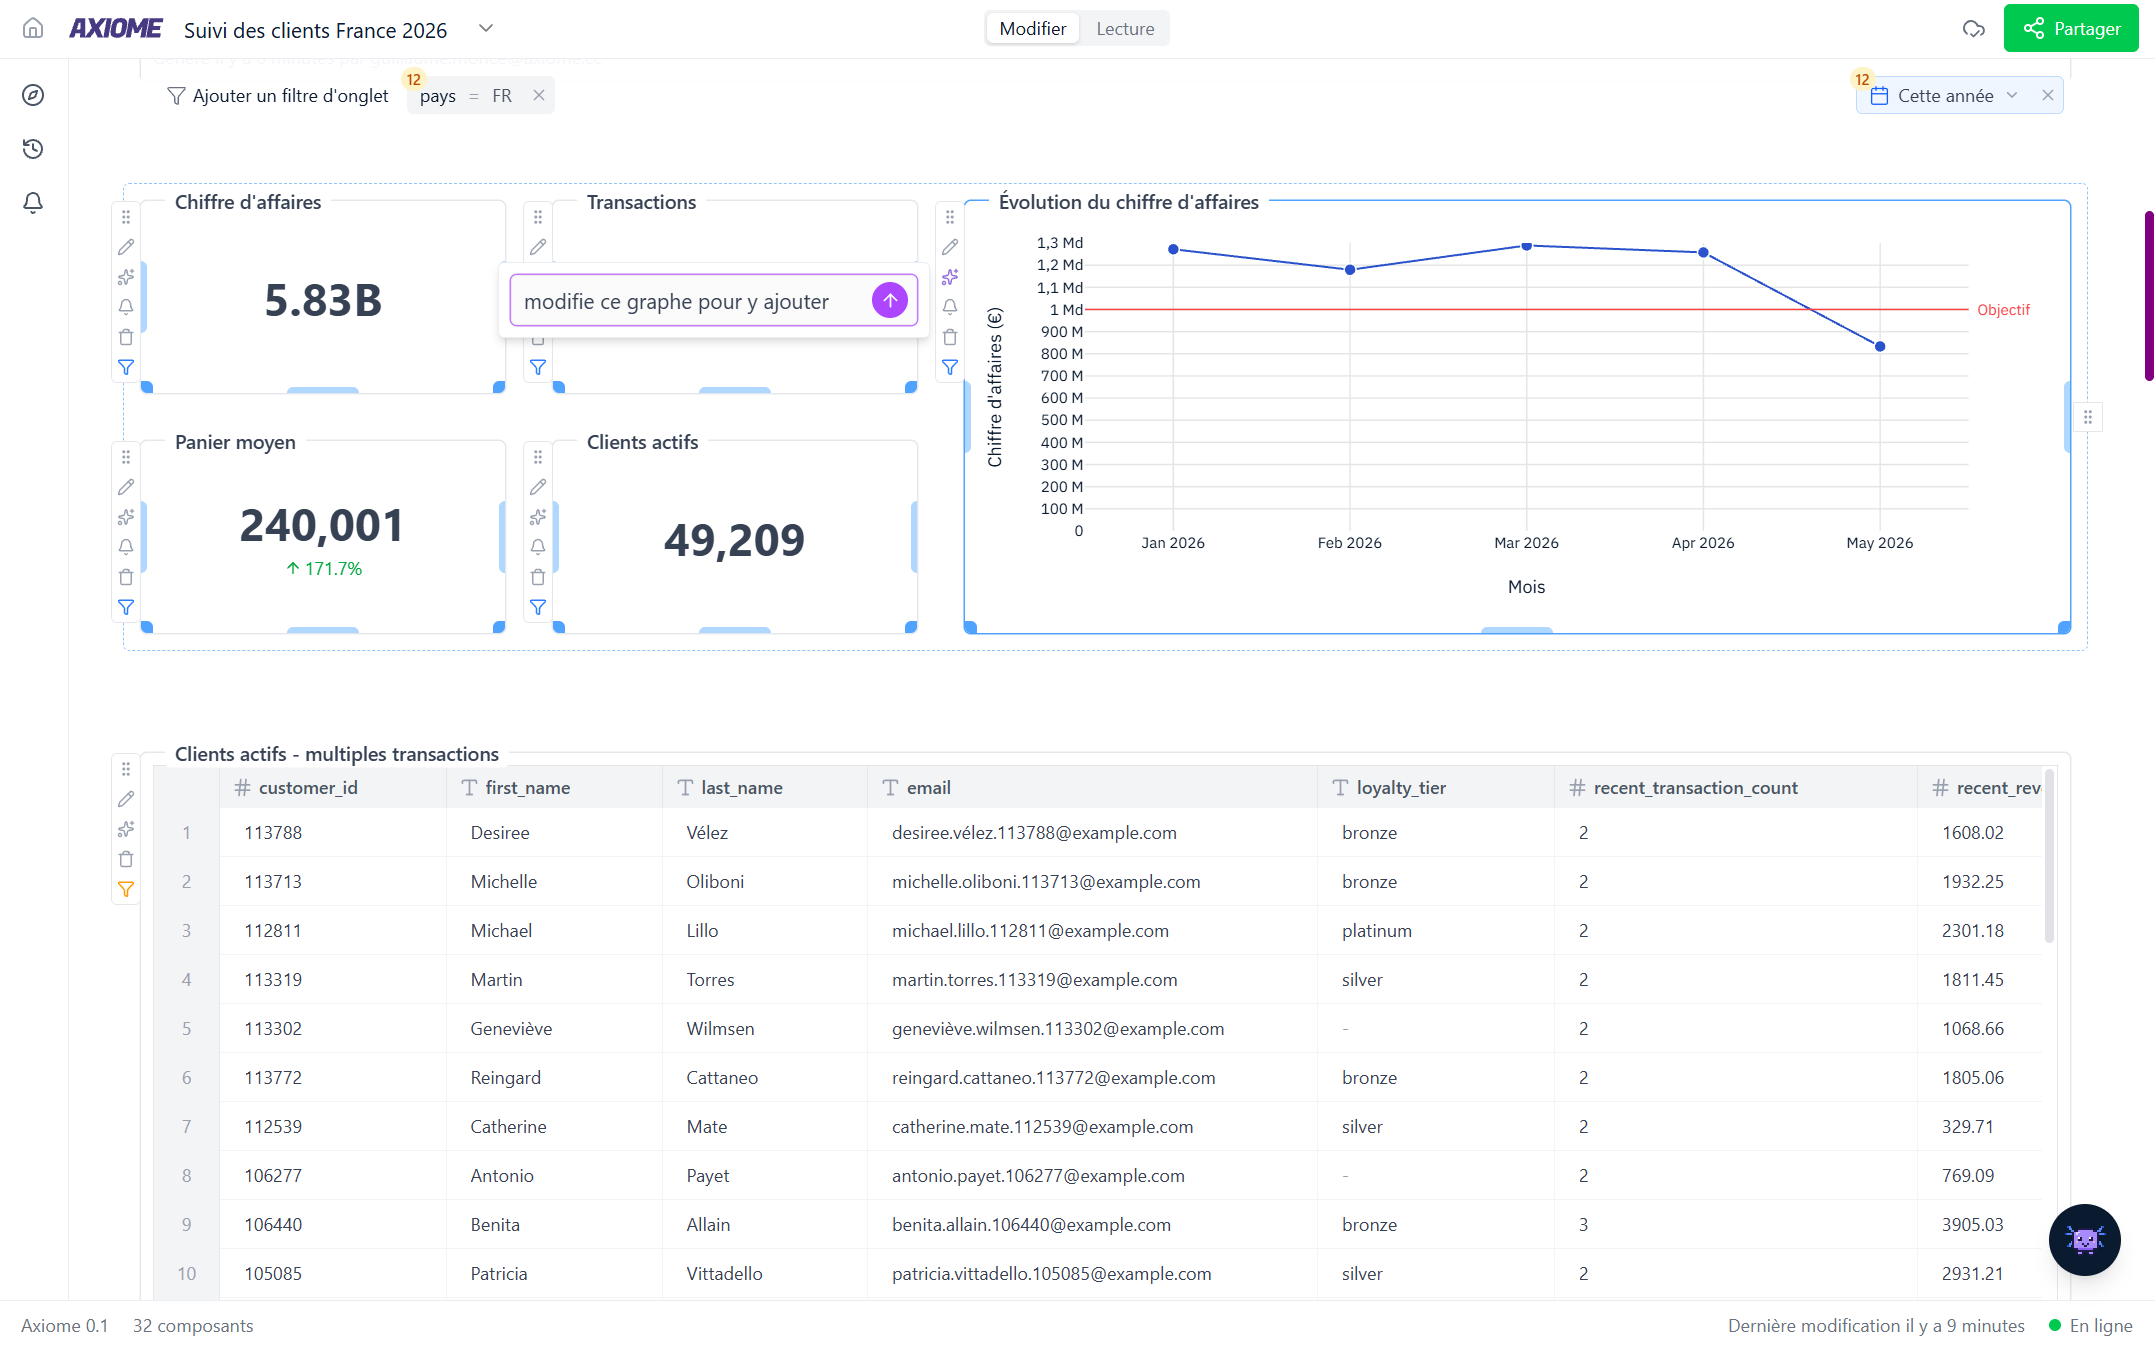
Have a number explained
On a chart, click a point and choose Explain this data. Axi looks at what's behind that exact value and tells you what's driving it — and whether it looks normal or unusual.
Get better answers
- Use your company's terms. If your team's metrics are set up in Axiome, asking for "revenue" uses the official definition — same as every dashboard.
- One request per message. Chain follow-ups rather than packing five asks into one sentence; messages run in order anyway.
- Correct it in the thread. "Not per day — per week, and only France" works; Axi keeps the context.
What Axi will never do
Knowing the limits is what makes the tool trustworthy:
- Invent numbers. Every figure comes from your data, through the same definitions as your dashboards. If the data can't answer a question, Axi says so — it doesn't guess.
- Change your data. Axi reads, never writes. Nothing it does can alter your databases.
- Act in the dark. Every widget Axi creates or edits is attributed to Axi in the dashboard History, and your administrators can monitor AI activity across the workspace.
- See beyond your reach. Axi works within your workspace and your permissions — nothing more.
- Replace your judgment. Axi is a fast, rigorous analyst; the business decisions stay yours.