Analyzing your data with Axi
Building dashboards is only half of what Axi does. The other half — often the more valuable one — is analysis: treat Axi like a data analyst sitting next to you, and ask.
Ask real business questions
From the "Ask Axi anything..." box on Home, ask the questions you'd ask an analyst:
- "How did revenue evolve over the last 6 months?"
- "Which products drive the most revenue this quarter?"
- "Are sign-ups growing faster in France or in Germany?"
- "Summarize what changed in our numbers this month."
Axi queries your data, answers with actual figures, and backs the answer with charts or tables when they help. Nothing to configure first — just ask.
Dig in with follow-ups
An analysis is a conversation, not a single question. React to what Axi shows you:
- "Break that down by region."
- "Exclude internal accounts."
- "Same thing, but compared to last year."
- "Why the drop in March?"
Axi keeps the thread's context, so each follow-up sharpens the picture instead of starting over.
Axi often suggests the next question itself, as buttons under its answer — click one instead of typing. They're a good way to find the angle you hadn't thought of.
Have a number explained
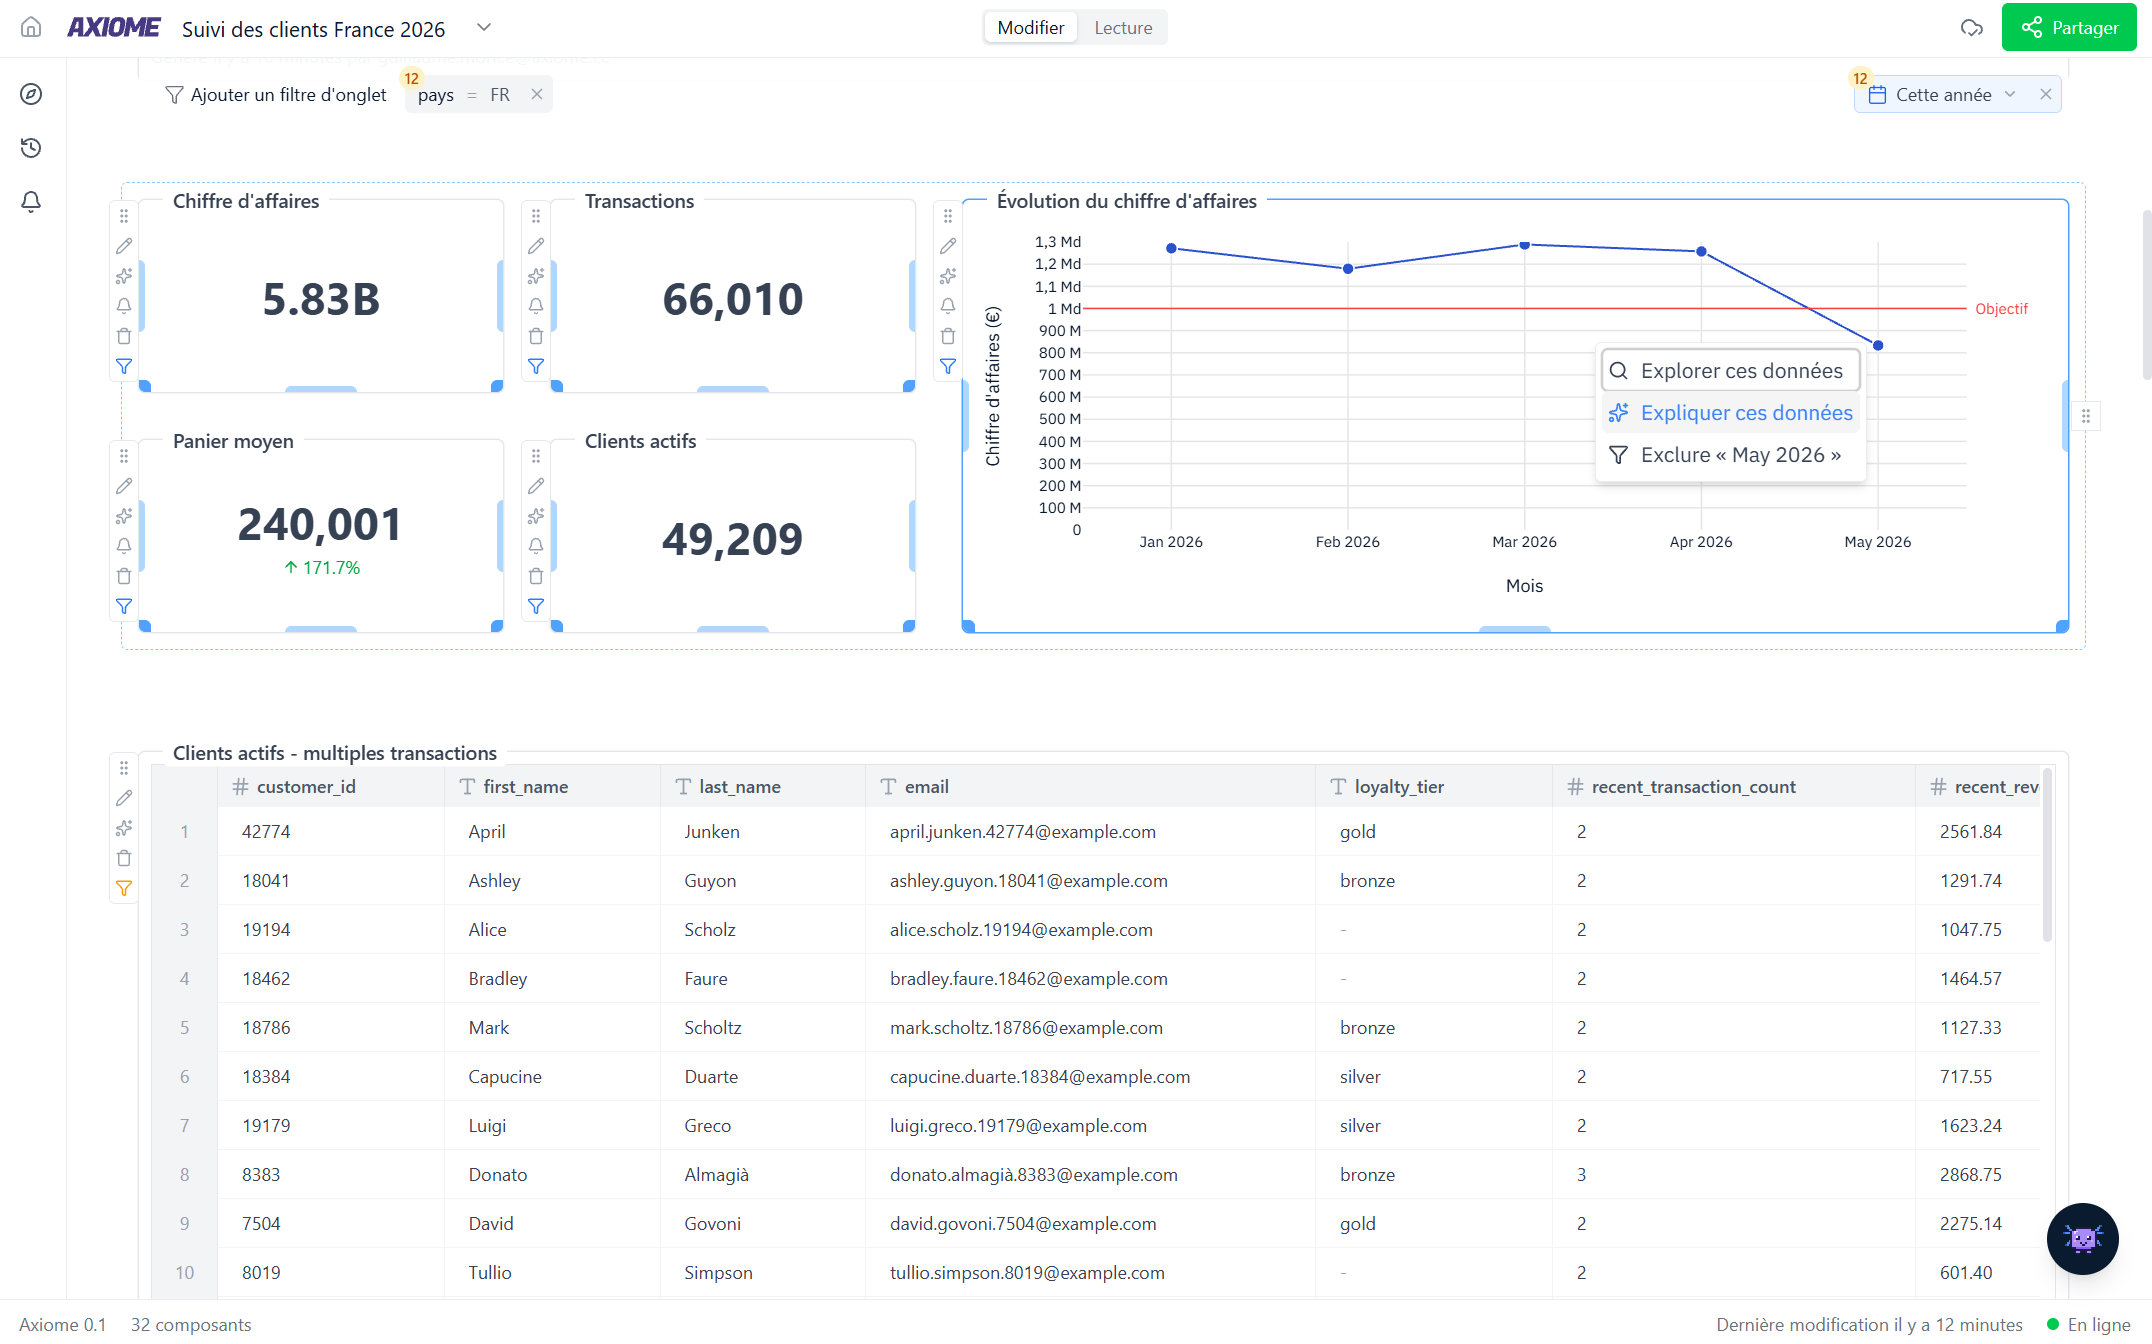
Spotted something odd on a chart — a spike, a dip, an outlier? Click the point and choose Explain this data. Axi receives that exact value with its context, investigates what's driving it, and tells you whether it looks expected or unusual.
Clicking into a chart needs the dashboard in Edit mode. From View mode, ask Axi in the panel instead — describe the widget and what surprised you.
Keep what you find
Any chart or table Axi produces during an analysis can be saved: click Add to dashboard and pick the destination. Your exploration becomes reporting in one click.
When to ask Axi vs. build by hand
| You want to… | Best move |
|---|---|
| Answer a one-off question | Ask Axi on Home |
| Understand a surprising number | Explain this data on the chart |
| Monitor something every week | Build (or have Axi build) a dashboard widget |
| Tweak an exact visual detail | Open the widget's editor yourself |
If the question matters to your business, it's worth asking — the worst case is Axi telling you the data can't answer it. That answer is useful too: pass it to your administrator, who can enrich the data model.